Graphs view for airports
Data acquisition
Download nodes, ways and relations with the aeroway tag within area marked with ICAO code for Zurich airport.
from cartes.osm import Overpass
airport = Overpass.request(
    area={"icao": "LSZH", "as_": "airport"},
    nwr=[dict(aeroway=True, area="airport")],
)
Data preprocessing
Build a graph from the airport data, using elements with tags geometry, aeroway, parking_position and holding_position.
graph =  airport.network_graph(
    "geometry",
    "aeroway",
    "parking_position",
    "holding_position",
    "ref",
    "name",
    query_str='aeroway == "taxiway" or aeroway == "runway" or '
    'aeroway == "parking_position" or aeroway == "holding_position"',
)
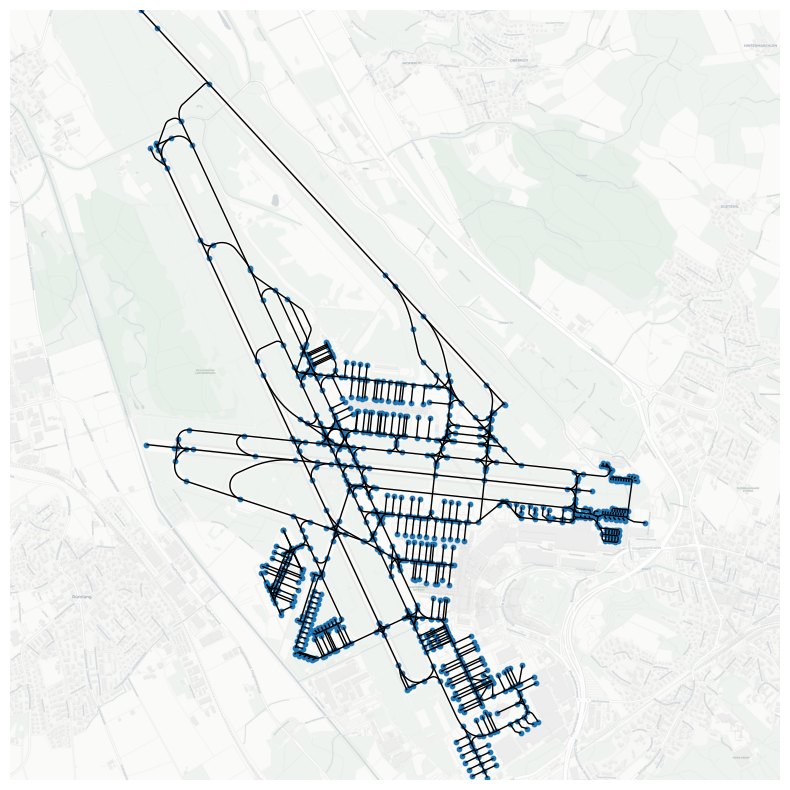
Data visualisation
import matplotlib.pyplot as plt

from cartes import tiles
from cartes.crs import PlateCarree, Mercator

fig, ax = plt.subplots(
    figsize=(10, 10),
    subplot_kw=dict(projection=Mercator.GOOGLE),
)

for u, v, data in graph.edges(data=True):
    ax.add_geometries(
        [data["geometry"]],
        crs=PlateCarree(),
        facecolor="none",
        edgecolor="black",
    )

pos = dict((node, data["pos"]) for (node, data) in graph.nodes(data=True))
lon_, lat_ = zip(*pos.values())
ax.scatter(lon_, lat_, s=10, transform=PlateCarree())

tiles_ = tiles.Basemaps(variant="light_all")
ax.add_image(tiles_, 16)

ax.set_extent(airport, buffer=0)
ax.set_square_ratio(crs=projection)
ax.spines["geo"].set_visible(False)