import matplotlib.pyplot as plt
from cartopy.crs import Mercator
from cartopy.mpl.geoaxes import GeoAxes
from cartes import tiles
from cartes.osm import Nominatim
# specify the type of GeoAxes to get proper completions
ax: GeoAxes
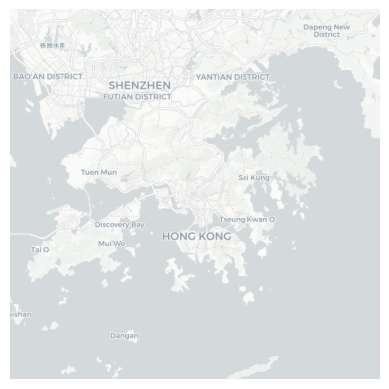
fig, ax = plt.subplots(subplot_kw=dict(projection=Mercator.GOOGLE))
# select the tiles
tiles_ = tiles.Basemaps(variant="light_all")
ax.add_image(tiles_, 10)
# fix the extent, use Nominatim to get the bounding box of Hong-Kong
ax.set_extent(Nominatim.search("Hong-Kong"))
# make the plot square
ax.set_square_ratio(crs=Mercator.GOOGLE)
# remove the frame
ax.spines["geo"].set_visible(False)